T cells are a crucial part of the human immune system and a core arm of adaptive immunity. They can recognize epitopes presented by major histocompatibility complex (MHC) molecules and then kill the corresponding harmful cells. They are like the body’s “special forces”: they can precisely identify and destroy virus-infected cells and tumor cells. TCR-T therapy, TIL therapy, and tumor vaccines are all therapeutic strategies developed from the ability of T cells to kill tumor cells.
TCR-T cell therapy: Ordinary T cells are collected from a patient’s peripheral blood. A gene encoding a specific T cell receptor (TCR) is introduced into these cells in vitro by genetic engineering, so that they can specifically recognize and bind intracellular antigens presented by tumor cells as peptide-major histocompatibility complex (pMHC). The engineered cells are expanded in vitro and infused back into the patient to achieve targeted killing of specific solid tumor cells.
TILs therapy: Tumor tissue is obtained through surgery, and lymphocytes that have naturally infiltrated the tumor and already have tumor-antigen-recognition ability are isolated from it. These tumor-infiltrating lymphocytes (TILs) are massively expanded and activated in vitro with cytokines, and then reinfused into the patient after lymphodepletion. Their natural polyclonal target-recognition ability is used to kill tumor cells.
Therapeutic tumor vaccines: Tumor sequencing and computational screening are used to identify tumor-specific mutant neoantigen epitopes. These epitopes are then formulated as mRNA, peptide, or cellular vaccines and injected into the patient. By activating antigen-presenting cells in vivo, the vaccine induces and expands the patient’s own tumor-specific T cells, thereby helping clear residual tumor lesions and prevent recurrence.
Most of these approaches require screening for TCR-pMHC pairs that can recognize each other, so TCR-pMHC or TCR-epitope pair prediction models such as pMTnet, ERGO, and TEIM have emerged (Lu et al., 2021; Springer et al., 2020; Peng et al., 2023). Calling this simply “binding” is not very accurate, so I use “pair” here, because the core goal is T-cell activation; I will explain this more concretely later. Two years ago, when I first received this task, I knew almost nothing about immunology. At that time, I chose the most common strategy: pretraining a sequence model with a masked-learning task so that it could learn distributional patterns, and then using a data-driven fine-tuning approach to directly learn TCR-pMHC pairing patterns. Although the work was eventually published, during training we already found that TCR-pMHC training data have many problems: the data are scarce, the measurement standards are inconsistent, and the epitope distribution is severely biased. Because TCRs are generated by V(D)J recombination, the feature space of TCR-pMHC pairs is enormous. In addition, whether a TCR-pMHC pair works can be extremely sensitive to mutations. With the amount of data currently available, it is therefore difficult to train an accurate and generalizable TCR-pMHC pair prediction model. Many papers perform reasonably well on their own test sets, but once transferred to another setting, their performance is almost equivalent to random guessing.
It was from this point that I increasingly felt the importance of understanding the scientific problem, especially in fields where data are scarce. If we want to truly solve the problem, we must understand the underlying mechanisms, constrain the possible search space with prior knowledge, and do more elegant work that yields better results. T cell activation may look like a simple “activated or not” label, but behind it are many layers: antigen processing, HLA presentation, TCR sequence, three-dimensional structure, cell state, co-stimulation, experimental system, and microenvironment. Human prior knowledge is therefore not an optional explanation; it is an important tool for narrowing the model’s search space, defining reasonable inputs and outputs, and discovering label bias. To better handle TCR-pMHC pairs, or more precisely the T cell activation task, I started to understand the background knowledge and key mechanisms. This note was written to help beginners, including myself, organize basic biology knowledge and learn recent immunology concepts for building better T cell activation prediction models.
I. Key Terms
1. MHC / HLA (Major Histocompatibility Complex / Human Leukocyte Antigen)
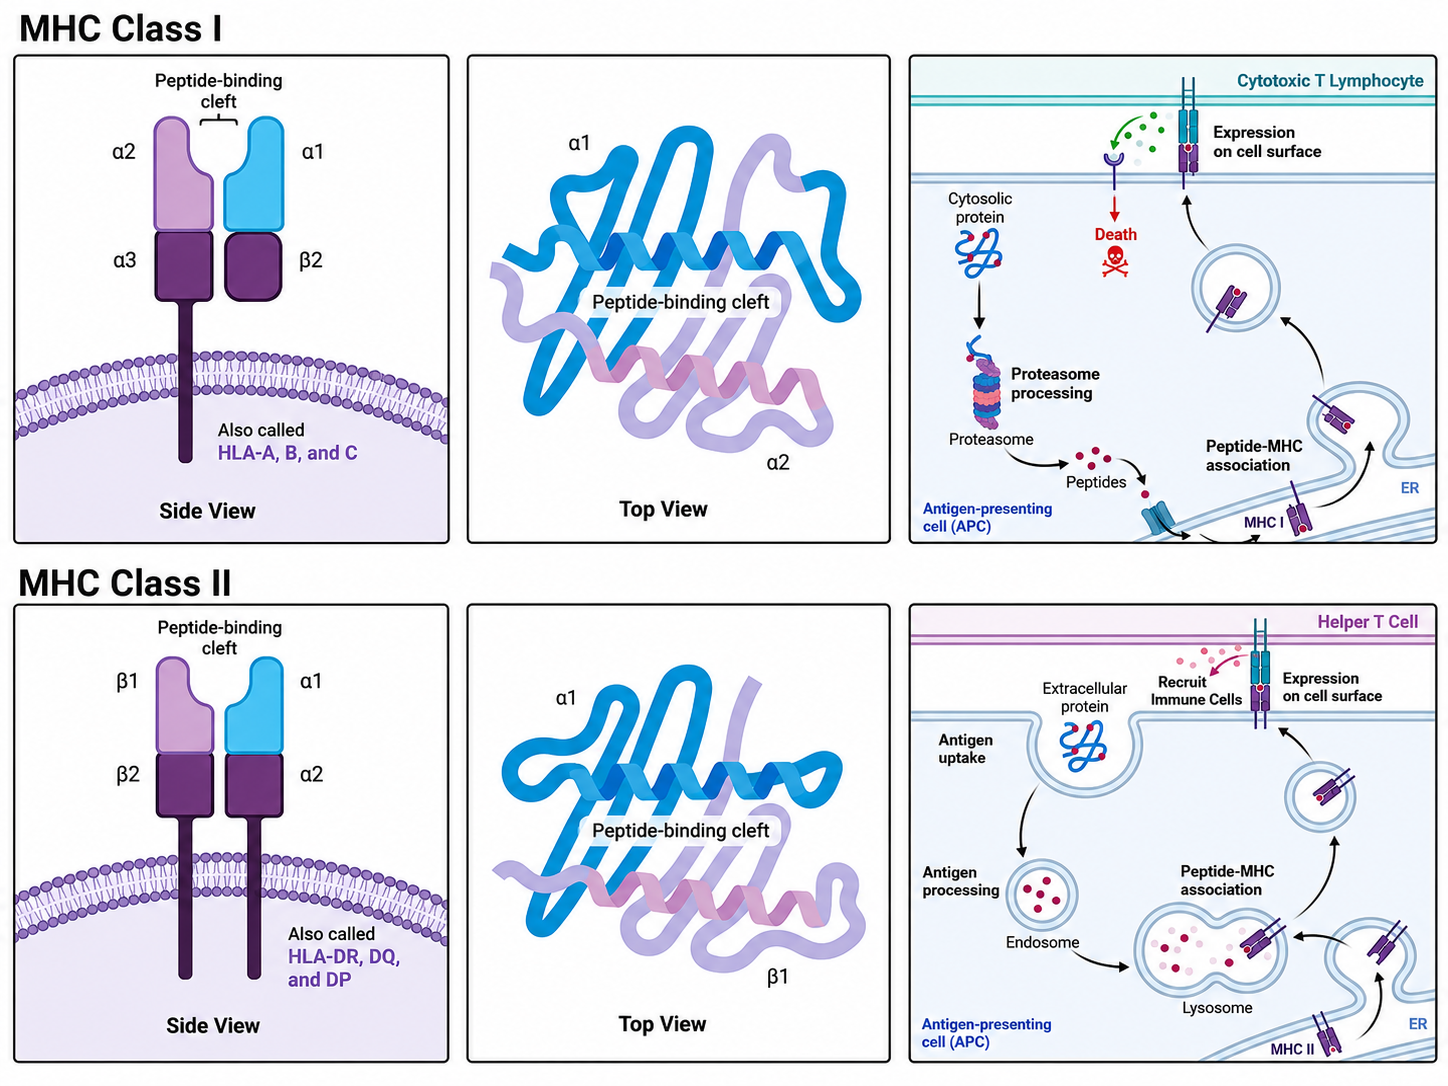
In humans, HLA molecules are mainly divided into Class I and Class II. Their molecular structures and oligomeric states are very different. For a broader overview of MHC antigen presentation, see Rock, Reits, and Neefjes, 2016.
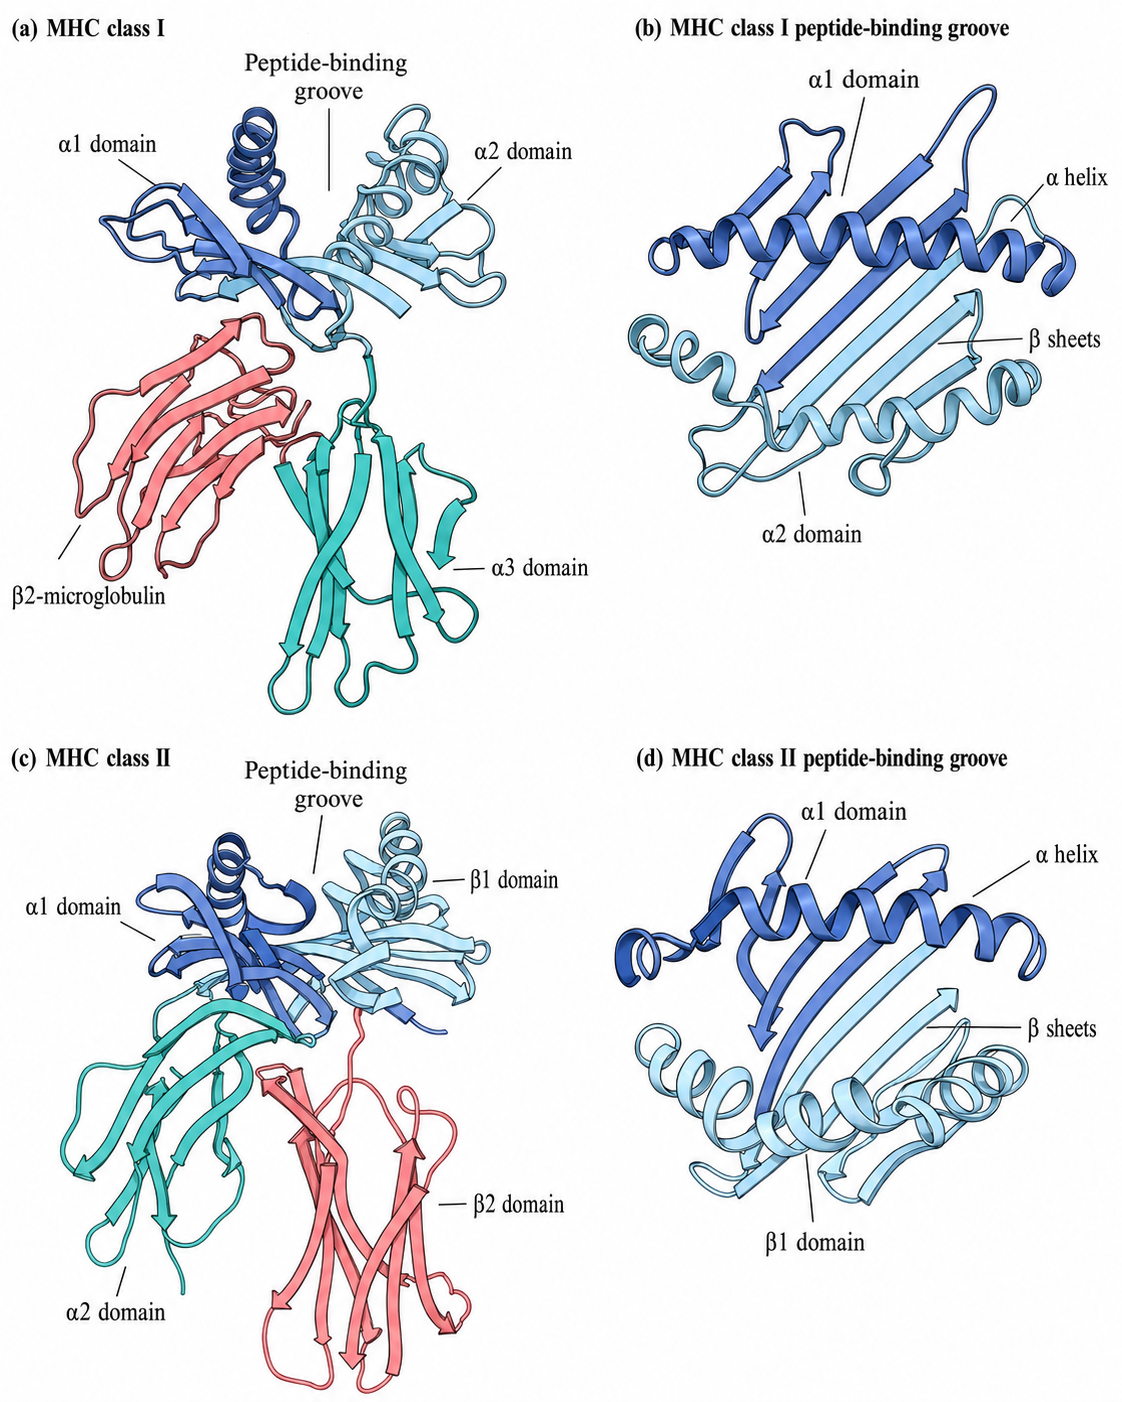
HLA-I Molecules (on the surface of all examined nucleated cells; see Figure 1a for structure)
- Oligomeric state: heterodimer. It consists of a heavy chain (the $\alpha$ chain) and a light chain ($\beta_2$-microglobulin, $\beta_2$m) connected by noncovalent interactions.
- Molecular weight and length: the $\alpha$ chain is about 45 kDa (about 340 amino acids); $\beta_2$m is about 12 kDa (about 99 amino acids).
- Functional domains:
- Antigen-binding cleft: formed jointly by the $\alpha_1$ and $\alpha_2$ domains. This is a closed groove-like structure, with both ends closed.
- Immunoglobulin-like region: the $\alpha_3$ domain, which binds the CD8 co-receptor on T cells, together with the independent $\beta_2$m.
- Transmembrane and cytoplasmic tail region: only the $\alpha$ chain extends into a transmembrane helix anchored in the cell membrane.
HLA-II Molecules (on professional antigen-presenting cells such as dendritic cells, B cells, and macrophages; see Figure 1b for structure)
- Oligomeric state: heterodimer. It consists of an $\alpha$ chain and a $\beta$ chain connected by noncovalent interactions.
- Molecular weight and length: the $\alpha$ chain is about 33-35 kDa (about 230-250 amino acids); the $\beta$ chain is about 28-30 kDa (about 230-240 amino acids).
- Functional domains:
- Antigen-binding cleft: formed jointly by the $\alpha_1$ and $\beta_1$ domains. Unlike Class I, this groove is open at both ends.
- Immunoglobulin-like region: the $\alpha_2$ and $\beta_2$ domains, with $\beta_2$ responsible for binding the CD4 co-receptor on T cells.
- Transmembrane and cytoplasmic tail region: both the $\alpha$ chain and the $\beta$ chain have their own transmembrane regions and short cytoplasmic tails.
How Many HLA Molecules Does Each Person Express?
The HLA gene complex is located on the short arm of human chromosome 6 (6p21.3). Because humans are diploid and inherit one chromosome set from each parent, the number of HLA molecules expressed in each person has clear genetic boundaries.
Core Classical HLA Molecules
The most important molecules in clinical and bioinformatics contexts are classical HLA molecules:
- HLA Class I: the three major loci are HLA-A, HLA-B, and HLA-C.
- HLA Class II: the three major loci are HLA-DP, HLA-DQ, and HLA-DR.
How Many Different HLA Proteins Can One Person Express?
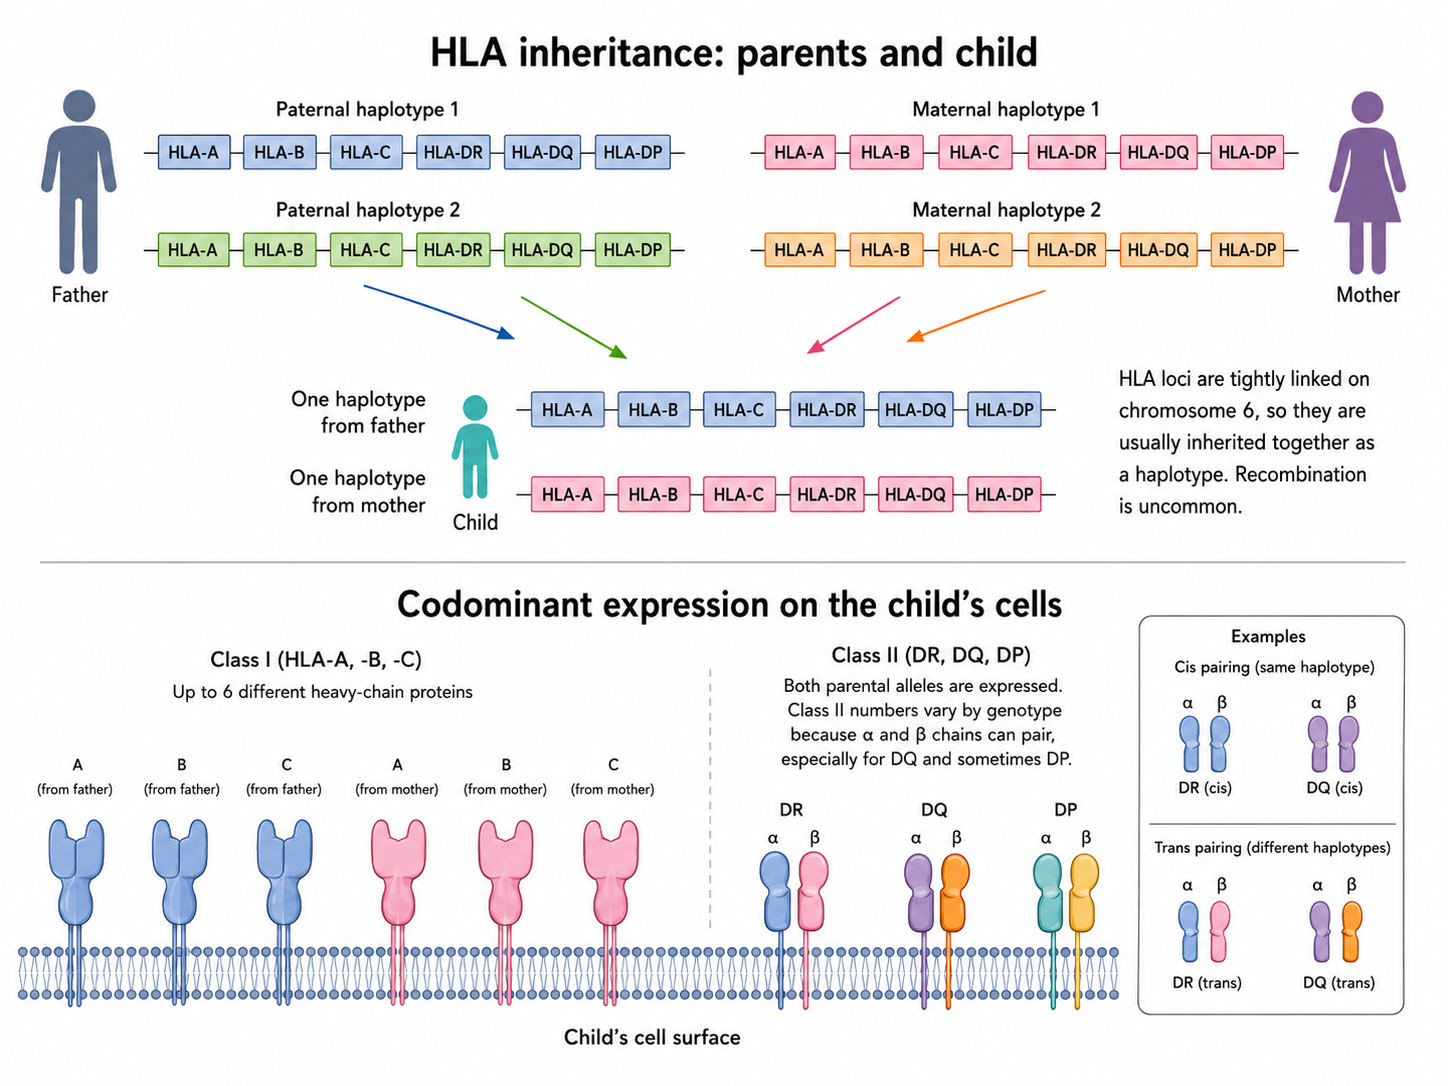
Because HLA genes are expressed codominantly, alleles inherited from both the father and the mother are simultaneously expressed on the cell surface.
- Theoretical maximum number (complete heterozygosity):
- Class I molecules: A, B, and C are three loci; if each parent contributes a different allele, then $3 \times 2 = \mathbf{6}$ different HLA-I heavy-chain proteins can be expressed.
- Class II molecules: DP, DQ, and DR $\alpha$ and $\beta$ chains are inherited from both parents. Because Class II molecules are $\alpha/\beta$ heterodimers, an $\alpha$ chain from the father can assemble with a $\beta$ chain from the mother. Therefore, each locus can theoretically generate four combinations, giving a maximum of about 12-16 different HLA-II complexes.
- Theoretical minimum number (extreme homozygosity): if the parents are highly related and pass down exactly the same HLA genes, that person would have only 3 Class I and 3 Class II molecules.
HLA Inheritance: Haplotypes and Linkage Disequilibrium
The HLA complex is one of the most polymorphic and complex regions in the human genome, and it follows very distinctive inheritance patterns.
Haplotype inheritance
Because HLA loci (A, B, C, DR, DQ, and DP) are packed very tightly on chromosome 6, homologous chromosomal recombination rarely occurs during meiosis when germ cells are formed (the recombination rate is $< 1\%$).
- A parent usually transmits the HLA gene group on one entire chromosome as a single unit, called a haplotype.
- Parent and child: any child must share one half of the HLA haplotypes with the father and the other half with the mother.
- Siblings: according to Mendelian inheritance, full siblings have a 25% chance of being completely HLA-matched, a 25% chance of being completely mismatched, and a 50% chance of sharing one haplotype. This is why bone marrow donors are often sought among siblings.
2. Epitope
In this note, I use epitope as the default term. In many TCR-pMHC contexts, antigen, epitope, and peptide are sometimes used to refer to the same MHC-presented short peptide. Strictly speaking, antigen can refer to the larger source molecule, epitope is the specific part recognized by the immune receptor, and peptide emphasizes the short amino-acid chain physically loaded into the MHC groove.
- Oligomeric state: a single-chain linear oligopeptide.
- Epitope length (the core difference):
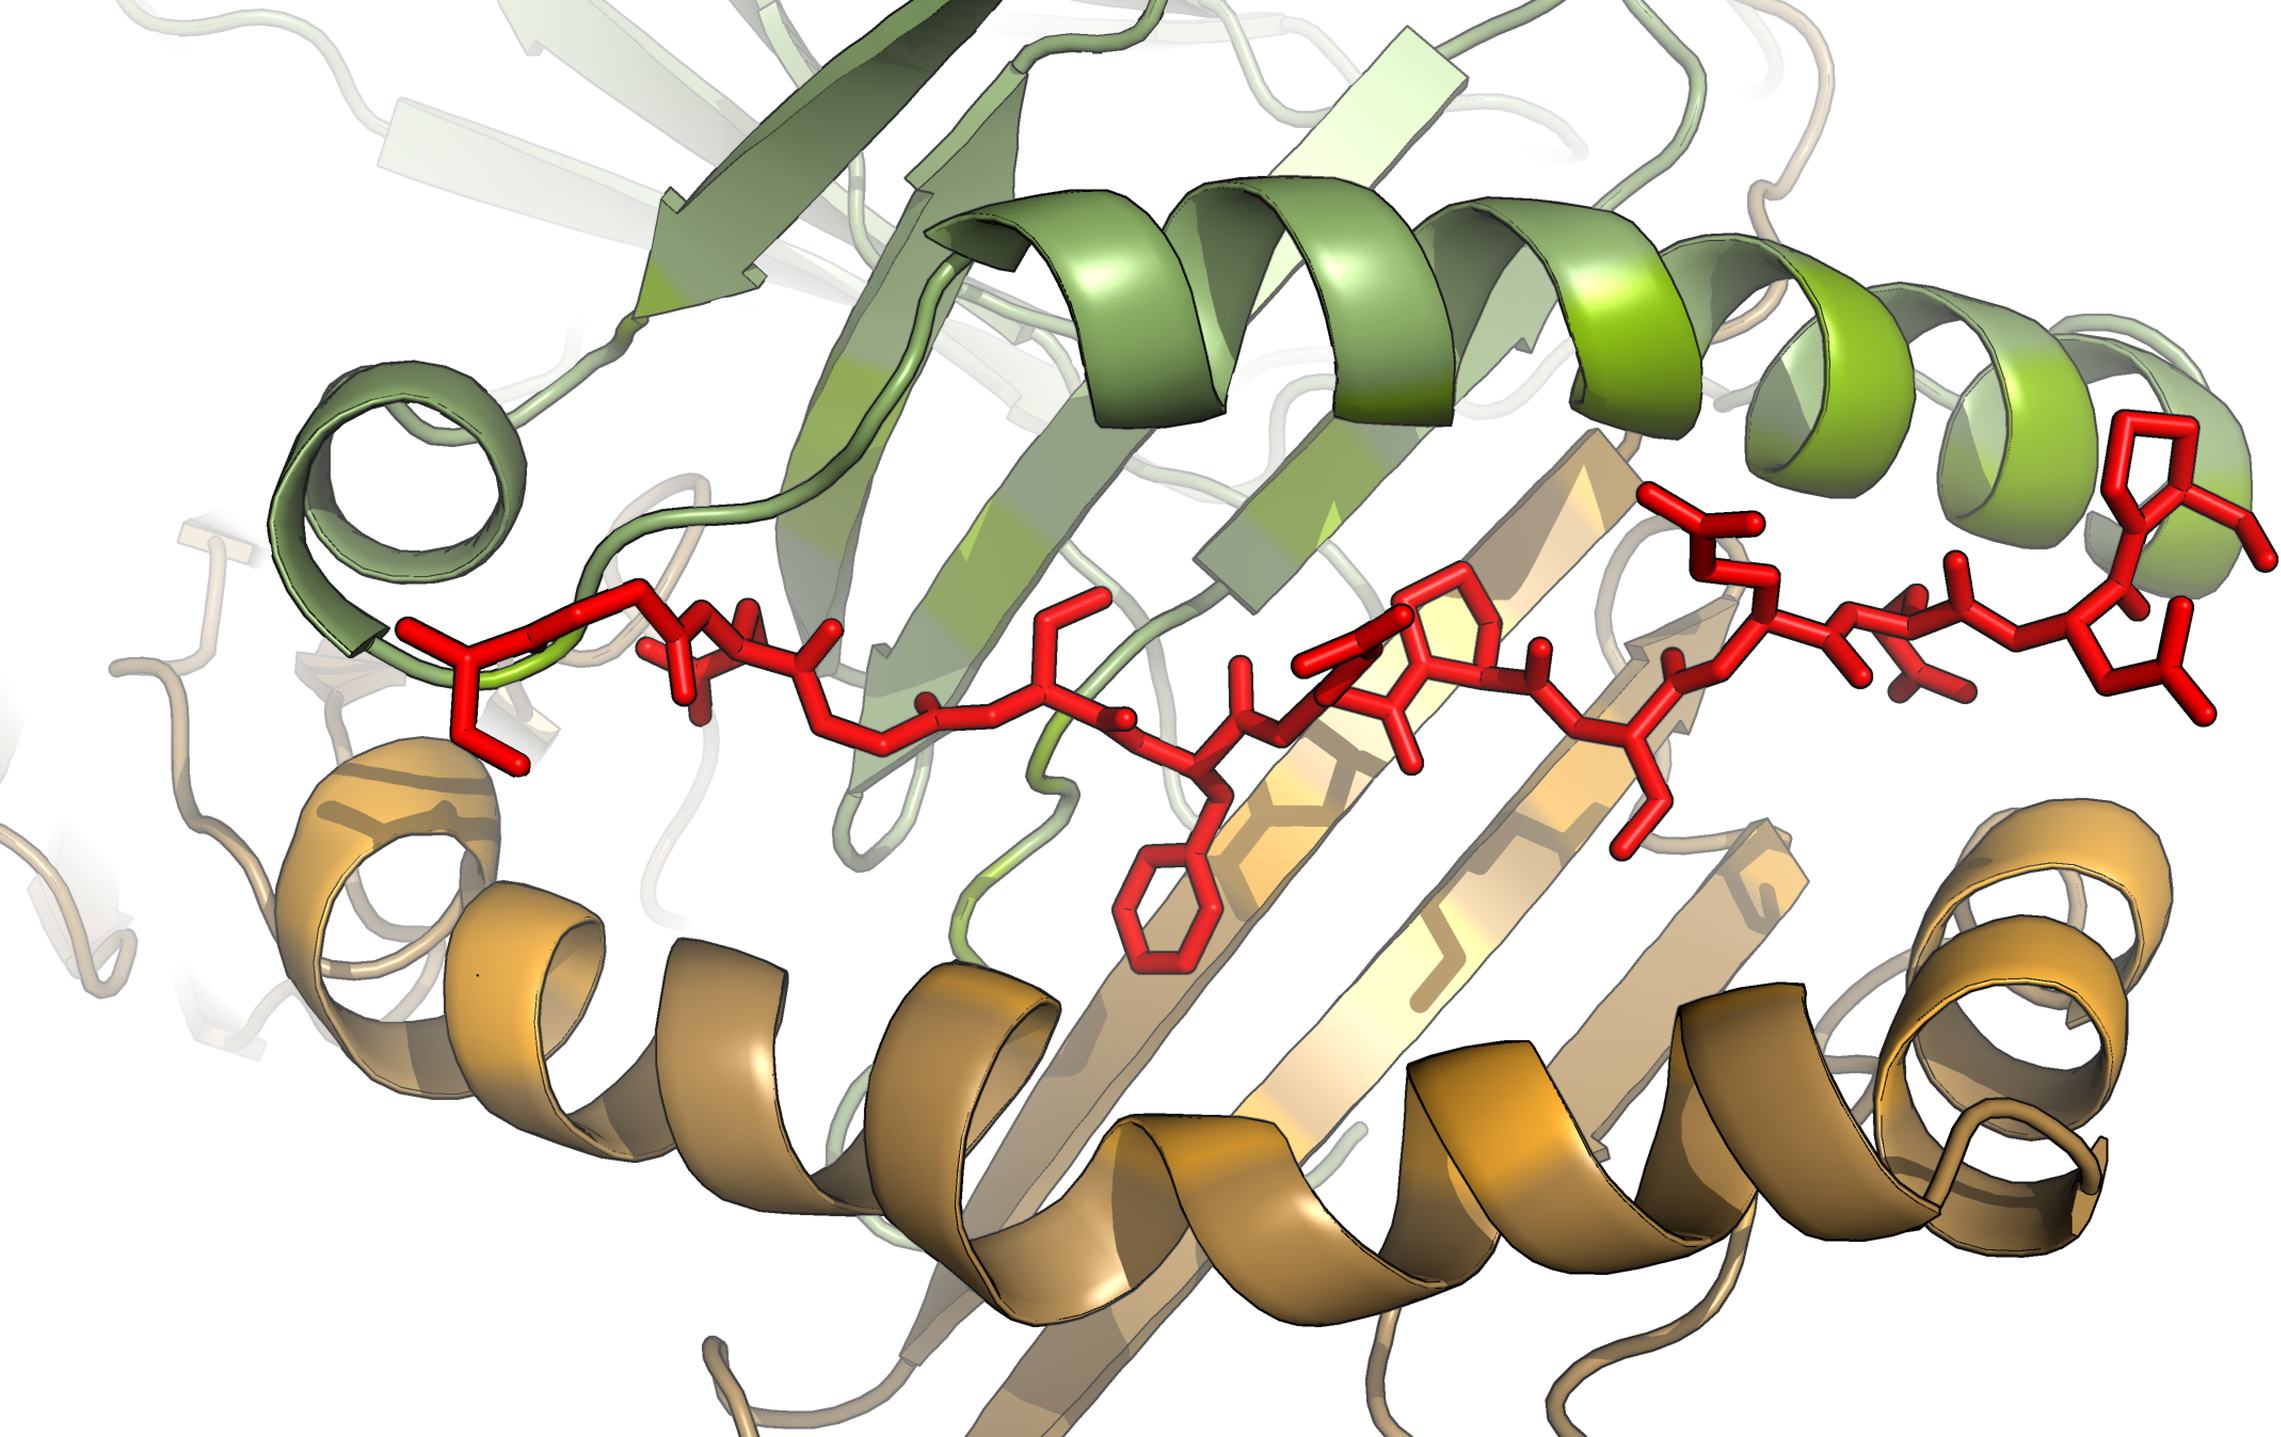
- Epitopes presented by HLA Class I: usually very constrained, most often 8-11 amino acids. Because the Class I groove is closed at both ends, the epitope must fit into the groove like a bowed string.
- Epitopes presented by HLA Class II: longer and less fixed in length, usually 13-25 amino acids. The core binding sequence is often about 9 amino acids, with extensions on both ends. Because the Class II groove is open at both ends, long epitopes can extend outward like noodles.
- Functional regions:
- Anchor residues: usually specific peptide positions, such as position 2 and position 9 in many Class I peptides. Their side chains are buried deep in pockets of the HLA binding groove and determine binding stability.
- TCR-contacting residues: amino acid side chains in the middle of the peptide that face outward and are solvent-exposed. They directly contact the TCR and determine recognition specificity.
3. T Cell
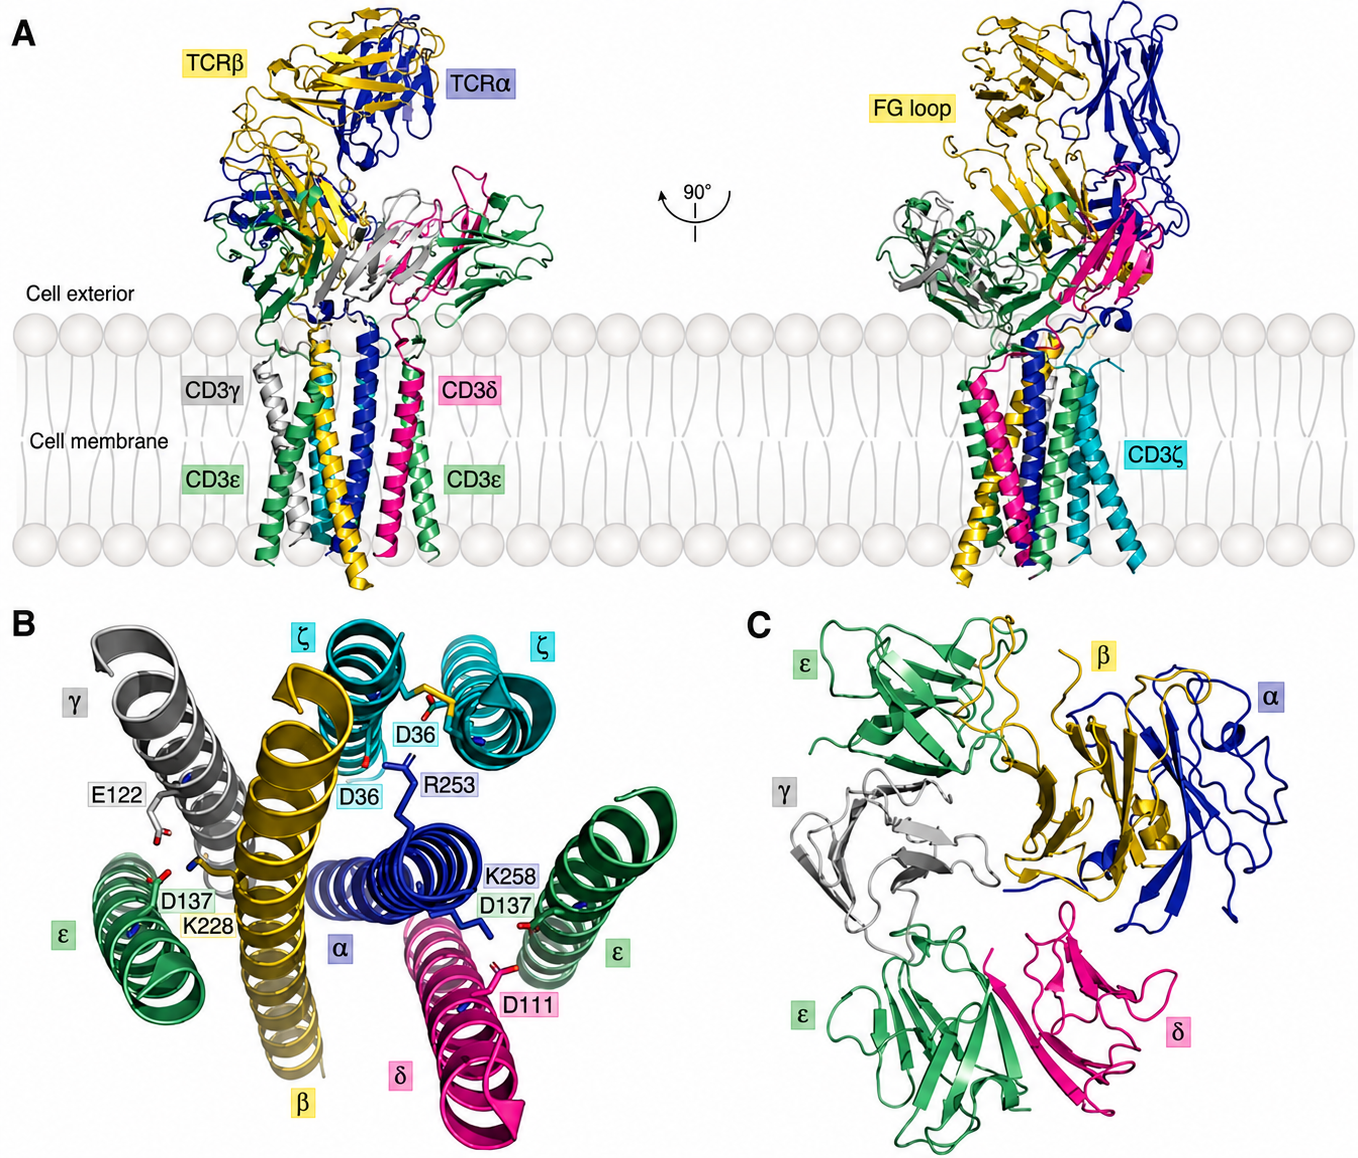
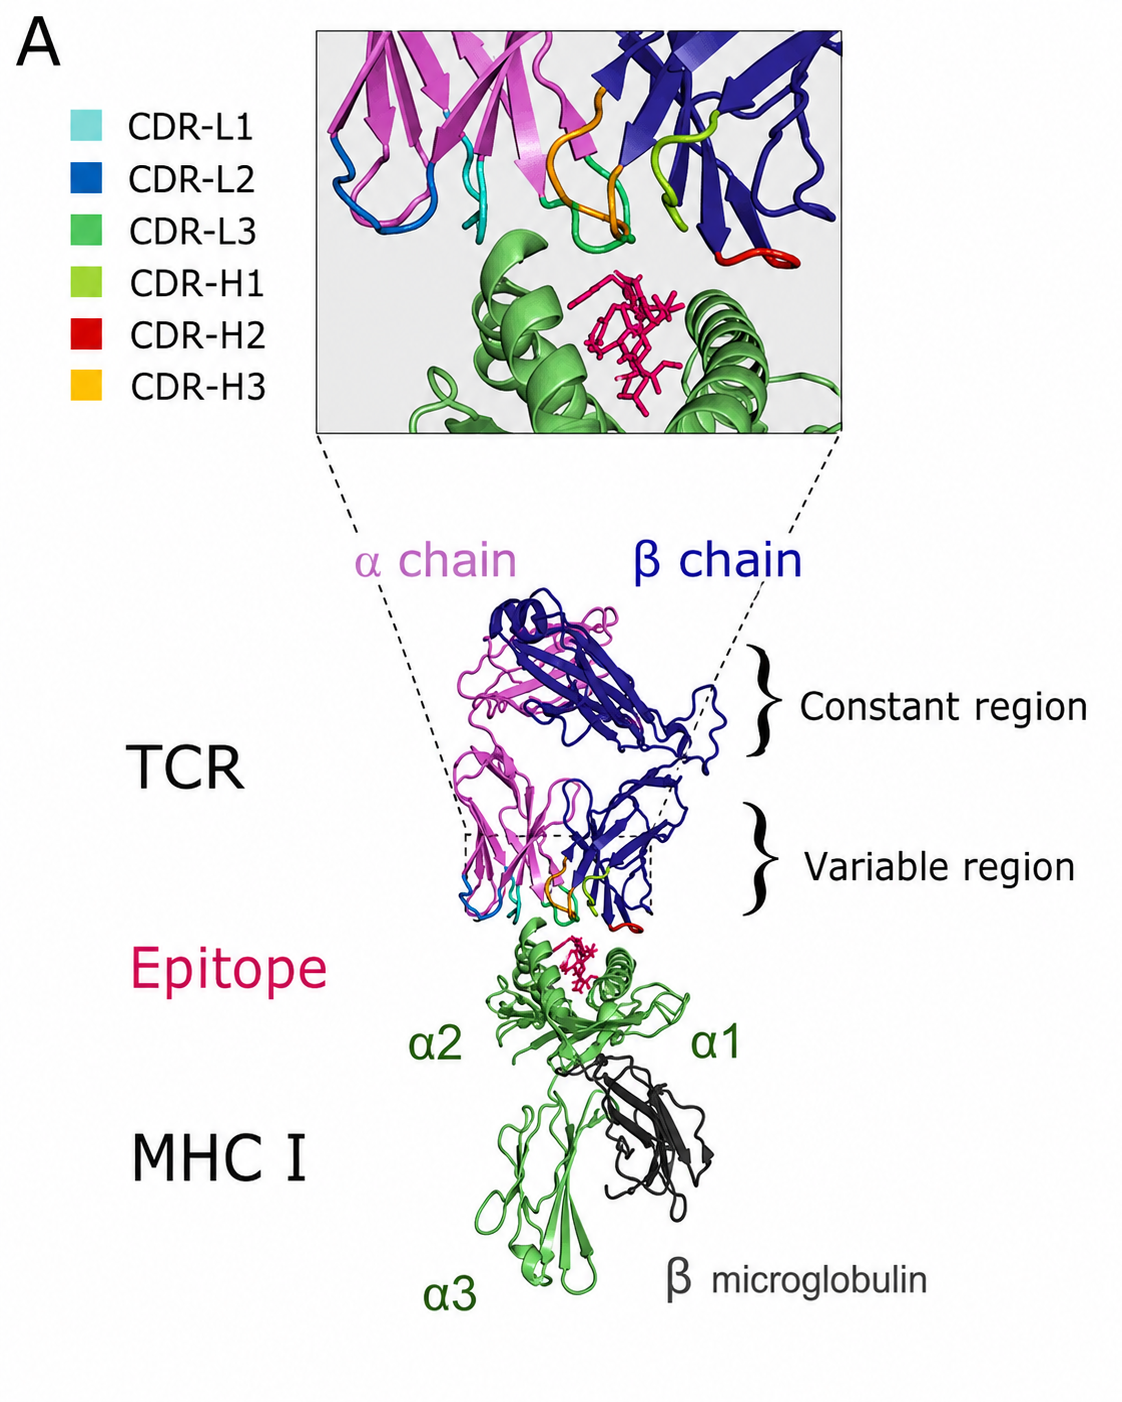
TCR (T Cell Receptor; see Figure 4)
More than 95% of conventional T cells in the human body express $\alpha\beta$ TCRs. A smaller fraction express $\gamma\delta$ TCRs. Structural studies of TCR-pMHC recognition are summarized in Rossjohn et al., 2015.
- Oligomeric state: heterodimer. It consists of an $\alpha$ chain and a $\beta$ chain covalently connected by a disulfide bond.
- Molecular weight and length: the total molecular weight is about 90 kDa. The $\alpha$ chain is about 40-45 kDa (about 250-270 amino acids), and the $\beta$ chain is about 45-50 kDa (about 260-290 amino acids).
- Functional domains:
The extracellular part of each chain consists of two highly conserved globular domains, similar to antibody Fab regions:
- Variable region (V$\alpha$ / V$\beta$): located at the outermost end.
- It contains the core functional regions: the CDR loops (complementarity-determining regions, CDR1, CDR2, and CDR3). Each chain has three CDRs.
- CDR1 and CDR2 mainly recognize and bind the $\alpha$ helices of HLA molecules, the conserved scaffold.
- CDR3, which is generated by gene rearrangement and has the greatest diversity, lies in the center and directly contacts the epitope. It is the absolute core determinant of T cell specificity.
- Constant region (C$\alpha$ / C$\beta$): located close to the cell membrane. Its structure is relatively fixed and supports the variable region while helping transmit activation signals.
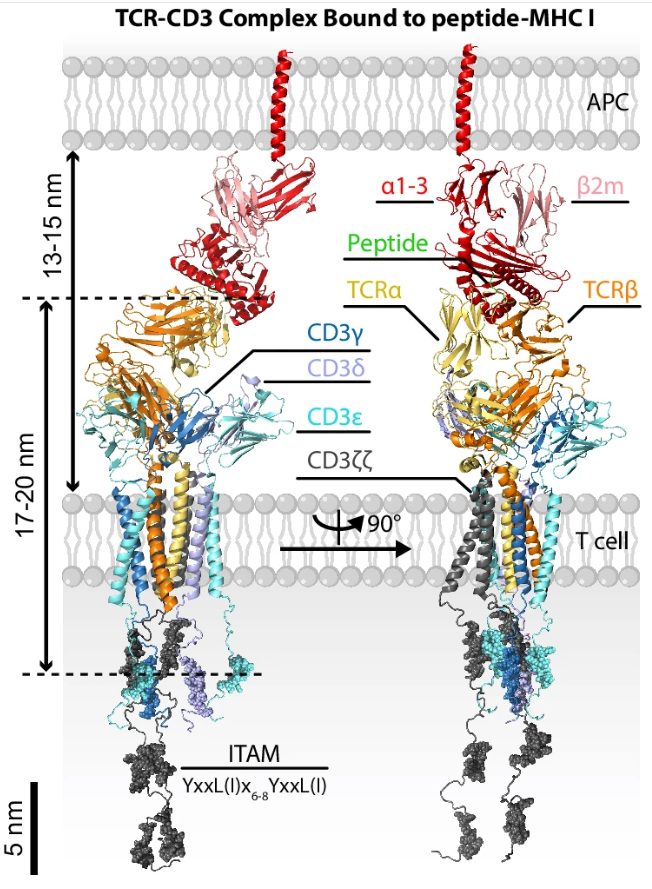
- Connecting region, transmembrane region, and cytoplasmic tail: the TCR has a positively charged transmembrane region. This means it must associate in the cell membrane with the negatively charged CD3 complex, composed of $\gamma$, $\delta$, $\epsilon$, and $\zeta$ chains, to form the TCR-CD3 complex, a high-order octameric molecular assembly that can truly transmit activation signals into the T cell. For the molecular architecture of this complex, see Dong et al., 2019.
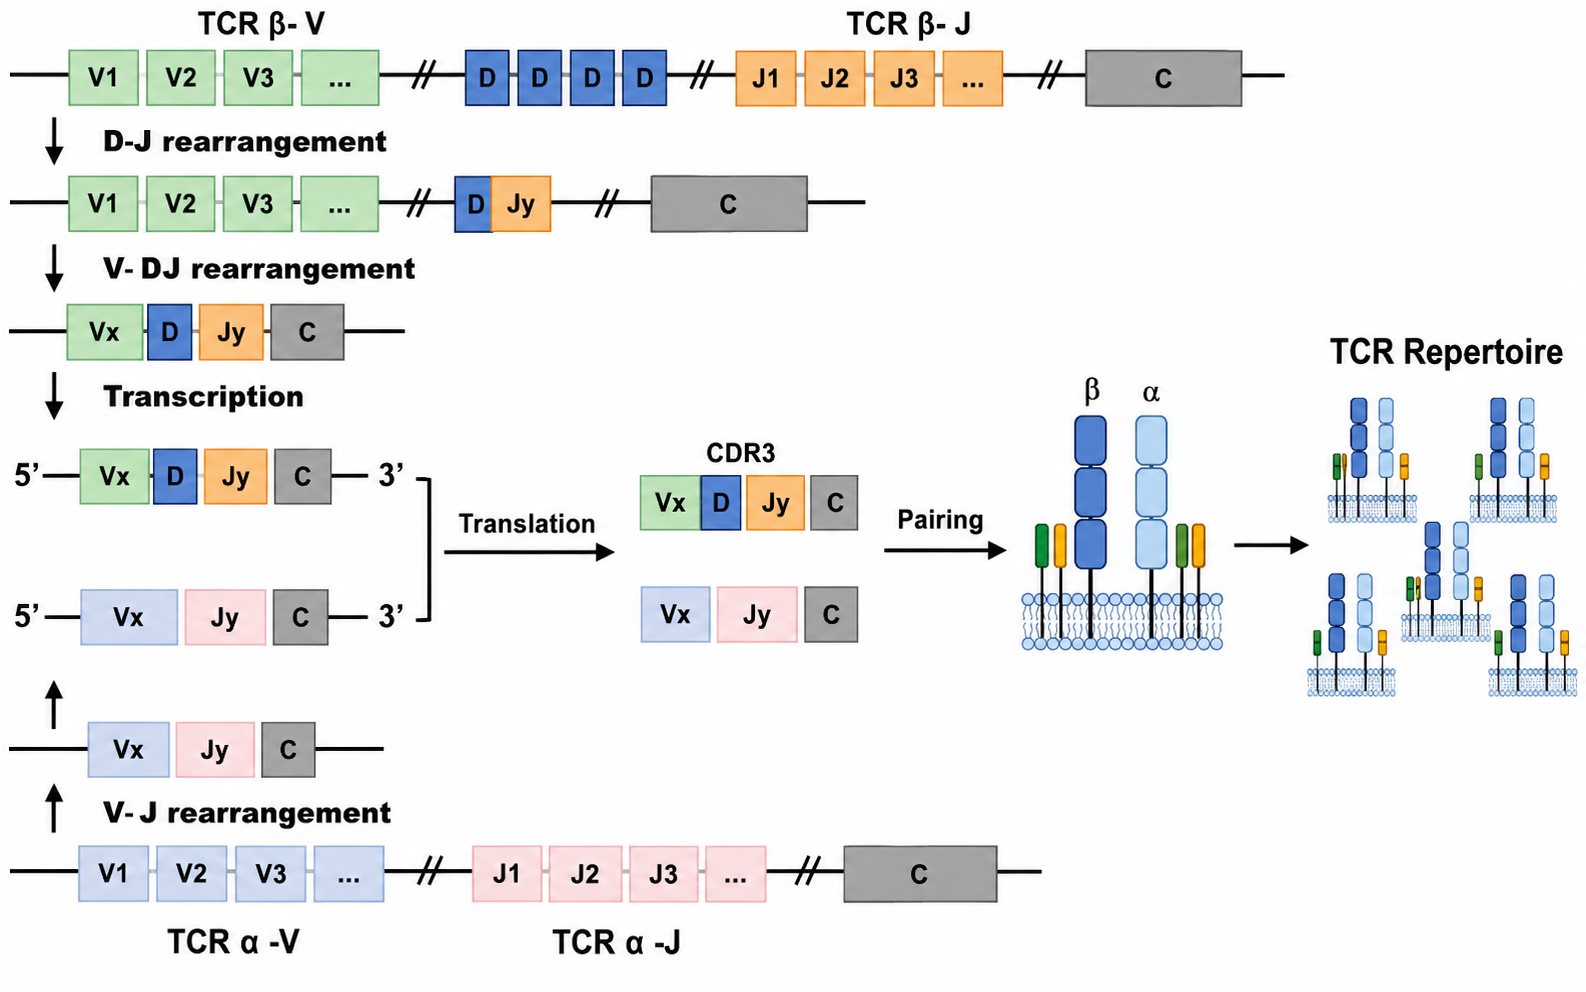
V(D)J Recombination: The Physical Drill Behind TCR Diversity
To recognize enormous numbers of foreign pathogens and tumor neoantigens, T cells rely on the extremely high diversity of the TCR variable region, especially the CDR3 loop. The human body can generate as many as $10^{15}$-$10^{18}$ different TCR sequences, even though the human genome contains only about 20,000 protein-coding genes. This “many receptors from limited genes” mechanism is achieved through V(D)J recombination, mediated by RAG recombinases and junctional diversity mechanisms.
The “Lottery” of Gene Segment Combination
During T cell development in the thymus, the coding gene segments of the TCR are broken up and distributed across the genome. These segments are mainly divided into three categories:
- V segment (Variable): the most numerous segment type, determining the main receptor structure.
- D segment (Diversity): present only in the TCR $\beta$ chain and $\delta$ chain. The $\alpha$ chain and $\gamma$ chain do not have D segments.
- J segment (Joining): connects the V/D segments to the constant region.
During recombination, lymphocyte-specific recombinases RAG-1 and RAG-2 intervene. They randomly select one V segment, one D segment if it is the $\beta$ chain, and one J segment, remove the intervening introns, and splice the selected segments together.
\[\text{TCR }\alpha\text{ chain recombination} = V_\alpha + J_\alpha\] \[\text{TCR }\beta\text{ chain recombination} = V_\beta + D_\beta + J_\beta\]Three Major Sources of Diversity
- Combinatorial diversity: random combinations of different V, D, and J segments. For example, the $\beta$ chain has about 40 $V_\beta$ segments, 2 $D_\beta$ segments, and 13 $J_\beta$ segments, giving $40 \times 2 \times 13 = 1040$ combinations. Adding random $\alpha$-chain combinations makes the number grow geometrically.
- Junctional diversity (key point): at the breakpoints where segments are joined, terminal deoxynucleotidyl transferase (TdT) randomly deletes or inserts several nucleotides (N-region insertion). This directly changes amino acid sequences and reading frames. As a result, even if exactly the same V, D, and J segments are chosen, the final TCR coding sequence can be completely different. This is the core reason why the CDR3 loop, the region that directly contacts the epitope, is so variable.
- Pairing diversity between the $\alpha$ chain and the $\beta$ chain: independently rearranged $\alpha$ and $\beta$ chains pair in space to form heterodimers.
CD3 Family Composition and Structure
As we saw earlier in cryo-EM structures, a complete TCR-CD3 complex (Figure 4) is a high-order octameric molecular machine. It is composed of one TCR dimer and three CD3 dimers that are tightly assembled.
- $\text{CD3}\epsilon\gamma$ heterodimer: composed of the $\epsilon$ chain (green) and the $\gamma$ chain (gray), located on one side of the TCR.
- $\text{CD3}\epsilon\delta$ heterodimer: composed of the $\epsilon$ chain (green) and the $\delta$ chain (pink), located on the other side of the TCR.
- $\text{CD3}\zeta\zeta$ homodimer: composed of two identical $\zeta$ chains (cyan), buried deep in the internal core of the complex.
II. T Cell Activation
Many receptors affect T cell activation, including CD4, CD8, CD28, and CD25. Below, I mainly discuss $\alpha\beta$ $\text{CD8}^+$ T cells and signals transmitted through the TCR, because the diversity mainly comes from the TCR.
1. MHC Presents Epitopes (Figure 6)
First, TCRs can only recognize epitopes presented by MHC.
HLA Class I molecules present endogenous epitopes, so they are the main force in killing tumor cells and are also the focus of this note. Normal nucleated cells continuously degrade old proteins and synthesize new ones. Cytosolic proteins are cut into short peptides of 8-11 amino acids, loaded by HLA Class I molecules in the endoplasmic reticulum to form pMHC complexes, and transported to the cell surface. When $\text{CD8}^+$ cytotoxic T cells find that the presented epitope is not a normal self-derived epitope, for example because the cell has become cancerous and produced a tumor neoantigen epitope or because it is virus-infected, they can directly release perforin and granzymes to initiate apoptosis.
HLA Class II molecules present epitopes derived from external bacteria, exogenous toxins, and related antigens. Professional antigen-presenting cells take these enemies into the cell through endocytosis or phagocytosis, digest them in lysosomes into long peptides of 13-25 amino acids, place them into the open groove of HLA Class II molecules, and transport them to the membrane surface for $\text{CD4}^+$ helper T cells. After recognition, $\text{CD4}^+$ T cells usually do not kill targets directly. Instead, they produce and secrete many cytokines, such as IL-2 and IFN-$\gamma$, to instruct B cells to produce antibodies or recruit macrophages to kill harmful cells.
Memory trick: HLA-I pairs with $\text{CD8}^+$ T cells, and HLA-II pairs with $\text{CD4}^+$ T cells. The products are both 8: $1 \times 8 = 2 \times 4 = 8$.
2. TCR Recognition of the Epitope-MHC Complex
The T cell receptor (TCR) is the key molecule on the T cell surface responsible for antigen-specific recognition. Unlike antibodies, TCR recognition follows strict MHC restriction, or dual-recognition, principles.
In other words, TCRs do not directly recognize free external antigens. They must recognize both the “epitope” and the “MHC molecule.” If the presented molecule is non-self MHC, or if a self MHC molecule presents a normal self-derived epitope, the TCR will not be activated. Only when a self MHC molecule presents an abnormal epitope, such as a tumor neoantigen epitope or viral epitope, can the TCR truly initiate a specific immune response.
At the microscopic structural level, most TCRs consist of an $\alpha$ chain and a $\beta$ chain, with highly variable complementarity-determining regions (CDRs) at the top. During recognition of pMHC (peptide-MHC) complexes, these regions have a precise division of labor:
- CDR1 and CDR2: mainly recognize the $\alpha$ helices at the top of the MHC molecule and confirm that the antigen-presenting carrier is a self molecule.
- CDR3: has extremely high sequence diversity. It reaches into the center of the MHC antigen-binding groove and precisely recognizes and binds the specific core amino acid sequence of the epitope.
3. Downstream Activation of the TCR-CD3 Complex
Although the TCR is responsible for precise recognition, its intracellular region is extremely short and cannot independently transmit activation signals into the cell. Therefore, it must bind CD3 molecules to form the complete TCR-CD3 complex. After the TCR successfully binds pMHC outside the cell, CD3 molecules use ITAM motifs in their cytoplasmic tails to cascade activation signals into the nucleus, thereby awakening the killing or helper functions of the T cell. For a concise overview of early TCR signaling, see Courtney, Lo, and Weiss, 2018.
Each CD3 chain has a long “tail” that extends into the cytoplasm. These tails are densely packed with core signaling elements: ITAMs (immunoreceptor tyrosine-based activation motifs).
- The cytoplasmic tails of the $\gamma$, $\delta$, and $\epsilon$ chains each contain 1 ITAM.
- The $\zeta$ chain has an unusually long cytoplasmic tail. Each $\zeta$ chain contains 3 ITAMs, so the $\zeta\zeta$ dimer contains 6 ITAMs in total.
Therefore, a complete TCR-CD3 octamer carries 10 ITAM signaling modules inside the cytoplasm. This high density of signaling sites is the physical basis for the T cell’s ability to produce cascade amplification and respond almost immediately to extremely small amounts of epitope-bearing pMHC.
Igniting the Signal Modules: Recruitment and Phosphorylation of Receptor-Proximal Kinases
This is the key first step that converts physical recognition into chemical signaling.
Approach and activation of Lck kinase
When the TCR binds pMHC on an antigen-presenting cell (APC), the T cell co-receptor (CD4 or CD8) also binds the conserved region of the MHC molecule. The cytoplasmic tail of CD4/CD8 carries a kinase called Lck, a Src-family tyrosine kinase. Co-receptor binding directly brings Lck close to the long cytoplasmic tails of the CD3 complex.
ITAM phosphorylation
Once brought nearby, Lck rapidly phosphorylates the ITAMs on each CD3 chain. Each ITAM contains two key tyrosine residues, with a sequence motif written as $YxxL/I(x)_{6-8}YxxL/I$. Lck phosphorylates both tyrosines. The 6 ITAMs on the $\zeta\zeta$ homodimer are especially important, and their efficient phosphorylation is central to downstream signal amplification.
Recruiting the Signal Amplifier: ZAP-70 Binding and Activation
Phosphorylated ITAMs change their conformation and chemical properties and become perfect landing pads.
ZAP-70 recruitment
A key cytoplasmic protein called ZAP-70, a Syk-family kinase, is present in the cytosol. ZAP-70 contains two tandem SH2 domains. These two SH2 domains precisely and tightly bind doubly phosphorylated ITAMs. At this point, ZAP-70 is anchored to the inner side of the cell membrane on the TCR-CD3 complex.
ZAP-70 activation
ZAP-70 bound to ITAMs is now exposed to Lck kinase. Lck phosphorylates ZAP-70 and fully activates it. At this stage, the original TCR-binding signal has been successfully transferred to ZAP-70, which acts as a super-amplifier to initiate downstream reactions.
During this process, the $\text{CD8}^+$ or $\text{CD4}^+$ molecules mentioned earlier also play an indispensable role as auxiliary receptors. They bind the non-polymorphic side of the MHC molecule, further stabilizing the spatial binding structure between TCR and pMHC and making activation-signal transmission stronger and more durable.
III. Hypotheses About T Cell Activation Mechanisms
The previous section described a relatively clear downstream pathway: TCR recognizes pMHC, CD3 ITAMs are phosphorylated by Lck, ZAP-70 is recruited and activated, and the signal then enters classical pathways such as LAT/SLP-76, Ca$^{2+}$-NFAT, MAPK/AP-1, and NF-$\kappa$B.
The truly difficult question is actually earlier: how does the TCR decide whether a pMHC is worth igniting? This question is very counterintuitive. On the one hand, T cells must have extremely high specificity, recognizing abnormal antigens that differ by only one or two amino acids amid a huge background of normal self-pMHC. On the other hand, they must also be highly sensitive: sometimes only a very small number of agonist pMHC molecules on a target cell are enough to trigger a T cell response.
Therefore, T cell activation is not a single switch. It is more like a multi-layer security system. Molecular binding kinetics, membrane spatial organization, mechanical force, receptor clustering, the cytoskeleton, co-receptors, and feedback regulation all participate in the decision. The following hypotheses are not mutually exclusive; they explain the same phenomenon from different scales. For broad discussion of TCR triggering mechanisms, see Chakraborty and Weiss, 2014.
1. Kinetic Proofreading
Kinetic proofreading is a classical model for explaining TCR specificity. Its core idea is simple: after TCR-pMHC binding, the T cell is not activated immediately. Instead, a sequence of signaling steps must be completed in order, such as CD3 ITAM phosphorylation, ZAP-70 recruitment, ZAP-70 activation, and LAT signalosome formation.
If a pMHC only weakly and briefly touches the TCR, it may dissociate before step 1 or step 2, so the signaling chain has no time to finish and the T cell will not be activated. Only pMHC molecules that remain bound long enough have the chance to complete this “checking process.” The original conceptual foundation comes from kinetic proofreading theory (Hopfield, 1974; McKeithan, 1995).
It can be imagined as a multi-stage password lock:
\[TCR\text{-}pMHC \rightarrow C_1 \rightarrow C_2 \rightarrow C_3 \rightarrow \cdots \rightarrow C_n \rightarrow \text{Activation}\]At every stage, the TCR-pMHC complex must not fall apart too early. In this way, even if two epitopes differ only slightly in binding lifetime, multi-step amplification can turn that small difference into a huge difference between “strong activation” and “no response.”
This model is important for modeling because it reminds us that we cannot only ask whether the TCR and epitope can bind. We must also care about off-rate, dwell time, the number of signaling steps, feedback strength, and readout time point. A pair that looks positive in a binding assay does not necessarily complete full activation.
2. Serial Triggering
Serial triggering tries to explain another phenomenon: why can a very small number of pMHC molecules still induce a clear T cell response?
This hypothesis proposes that one agonist pMHC does not serve only one TCR. It can bind one TCR, trigger part of the early signal, dissociate, and then bind another TCR. In other words, one pMHC is like a match head that can ignite multiple TCRs repeatedly on the membrane surface, thereby amplifying an extremely rare epitope signal. This idea was classically formulated by Valitutti et al., 1995.
This also explains why TCR-pMHC affinity is not simply “the higher the better.” If binding is too weak, the signal has no time to accumulate. But if binding is too strong, the pMHC may be occupied by one TCR for too long, which instead prevents it from serially triggering more TCRs. Effective activation may require a kinetic window: binding must be long enough to complete early proofreading, but not so long that turnover is completely lost.
3. Kinetic Segregation
Kinetic segregation explains TCR triggering from the spatial dimensions of the membrane surface. This model is strongly associated with the work of Davis and van der Merwe, 2006.
In the resting state, both ignition and extinguishing forces exist on the T cell membrane. The ignition side consists of kinases such as Lck, which phosphorylate CD3 ITAMs. The extinguishing side consists of phosphatases such as CD45, which remove phosphate groups. CD45 has a very large extracellular domain, like a giant mop, and can normally keep removing accidental weak phosphorylation signals so that the T cell stays quiet.
When TCR binds pMHC, the T cell membrane and the APC or target-cell membrane are locally pulled very close together. The TCR-pMHC complex itself is relatively short and forms a narrow close-contact zone. This space can accommodate TCR, pMHC, CD3, and Lck, but not CD45, whose extracellular region is very large.
The result is that CD45 is physically excluded from the local region, which shifts the balance from “kinases and phosphatases pulling against each other” to “kinases dominate.” Lck finally obtains a relatively clean ignition environment and can efficiently phosphorylate CD3 ITAMs.
4. Mechanosensing / Catch Bond
T cells do not quietly wait for antigens to float by. They scan, crawl over APCs or target cells, extend microvilli, and apply small mechanical forces to TCR-pMHC complexes through the cytoskeleton.
Traditional intuition says that after two molecules bind, pulling them apart makes them separate more easily. This is called a slip bond. But some TCR-pMHC interactions show catch-bond-like behavior: within a certain force range, external force does not make the bond fall apart faster. Instead, it makes the bond grip more tightly and live longer. Experimental evidence for TCR catch bonds and mechanosensing includes Liu et al., 2014 and related work.
This gives TCR epitope discrimination a beautiful physical mechanism:
- If the ligand is an ordinary self-pMHC, force quickly makes the complex slip apart, and the signal has no time to accumulate.
- If the ligand is a true agonist pMHC, force can move the TCR-pMHC binding conformation into a more stable state, extend bond lifetime, and transmit mechanical changes to the TCR-CD3 complex.
From a structural perspective, this force may be transmitted downward through the TCR variable region, constant region, and transmembrane region, changing the state of the CD3 extracellular domains and cytoplasmic tails. This may make ITAMs that were originally close to the membrane more accessible to Lck. Catch-bond engineering has already been used to tune TCR sensitivity while retaining physiological affinity and specificity (Zhao et al., 2022).
5. Conformational Change
The conformational-change hypothesis proposes that TCR binding to pMHC is not merely two surfaces sticking together. It may also induce structural changes inside the TCR-CD3 complex.
For example, TCR CDR loops, the epitope, MHC $\alpha$ helices, the TCR constant region, and transmembrane helices may all undergo small but important shifts after binding. These changes may further affect the position of the CD3 extracellular domains, the arrangement of transmembrane helix bundles, and even release CD3 cytoplasmic tails from the inner membrane surface so that ITAMs become easier for Lck to access.
The value of this hypothesis is that it pushes the question from “can it bind?” to “in what pose does it bind?” Two TCR-pMHC pairs may have similar affinity, but if their docking geometry, contact residues, force-transmission paths, and conformational changes differ, their final signaling ability may be completely different.
6. Clustering / Microclusters
The signal from a single TCR is weak. True activation often depends on many TCRs forming local clusters on the membrane surface. TCR microclusters can be viewed as small early signaling command posts.
After TCRs encounter agonist pMHC, signaling molecules such as TCR-CD3, ZAP-70, LAT, and SLP-76 rapidly accumulate locally. These microclusters usually appear before the immunological synapse matures and can initiate early signaling within seconds to tens of seconds. Later, they move toward the center of the cell contact interface with actin retrograde flow. For early evidence of TCR microclusters, see Campi, Varma, and Dustin, 2005.
This model explains why the T cell response is not just about a single pair. The distribution of pMHC on the membrane, TCR expression level, local diffusion rate, cytoskeletal flow, and LFA-1/ICAM-1 adhesion strength all affect whether microclusters can form, persist, and amplify signals.
7. Immunological Synapse
If microclusters are early small ignition points, the immunological synapse is the mature combat interface formed between the T cell and the target cell. The classic supramolecular activation cluster model was described by Monks et al., 1998 and subsequent work.
After a T cell forms stable contact with an APC or target cell, molecules at the contact surface rearrange into a target-like structure. This structure is often divided into several regions:
- cSMAC (central SMAC): the central region, enriched in TCR-CD3 and some molecules related to signaling and receptor recycling.
- pSMAC (peripheral SMAC): the peripheral region, enriched in adhesion molecules such as LFA-1/ICAM-1, acting like a sealing ring that stabilizes the contact between the two cells.
- dSMAC (distal SMAC): the outer region, where larger regulatory molecules and dynamic boundary structures are often found.
Early on, researchers thought the immunological synapse was the core starting point of activation. Later, it became clear that many early signals are already completed at the microcluster stage. A mature immunological synapse is more like an integration platform: it maintains long-term signaling, stabilizes cell-cell contact, organizes receptor recycling, and during CD8 T cell killing helps direct perforin and granzymes toward the target cell, reducing accidental damage to neighboring normal cells.
Thus, the immunological synapse is not merely “cells sticking together.” It is the result of the T cell organizing recognition, signaling, adhesion, and killing directionality into the same interface.
Real T cell activation is probably not completed by any single hypothesis alone. Instead, these mechanisms relay across different temporal and spatial scales: the TCR first scans pMHC on the membrane surface; suitable ligands remain long enough within a mechanical and kinetic window; local CD45 is excluded; Lck phosphorylates ITAMs; TCR microclusters form and amplify signals; finally, the immunological synapse matures and organizes signaling, adhesion, and killing output into a stable interface.
Therefore, for TCR-pMHC pair prediction, asking only “can it bind?” is often insufficient. The more biologically relevant question is: under a specific HLA, epitope density, cell state, co-stimulatory environment, and experimental readout, can this pair cross the T cell activation threshold?
From static docking to dynamic distributions: because both kinetic proofreading and catch-bond hypotheses emphasize dwell time and conformational change, considering only a traditional static structure, such as a single AlphaFold-predicted conformation, is not enough. Models need to capture epitope flexibility in the binding groove and the conformational-space changes induced after TCR binding. Only then can they make better use of limited data.
IV. Data
1. VDJdb
The dataset most widely used by current machine-learning models is VDJdb, a curated database of TCR sequences with known antigen specificity (Shugay et al., 2018; Bagaev et al., 2020). The data sources mainly fall into three major streams:
-
pMHC multimer sorting: this is the absolute main source of data and accounts for the largest fraction of VDJdb. Because the affinity between a single TCR and a single pMHC molecule is very weak and dissociation is fast, it is difficult to “fish out” specific T cells with a single pMHC molecule. The experimental principle is as follows: scientists assemble multiple identical pMHC complexes on the same scaffold, most commonly tetramers or dextramer multimers, which may contain dozens of pMHC molecules, and attach fluorescent labels. These multimers are mixed with peripheral blood mononuclear cells (PBMCs). Because multimers can simultaneously bind multiple TCRs on the T cell surface, they generate high-strength avidity, stabilizing the complex on the cell surface. Fluorescent T cells are then sorted by flow cytometry (FACS), and TCR sequencing is performed on those cells. Early studies often used bulk sequencing, whereas more recent studies often use single-cell sequencing. Data property: this represents physical binding. As noted earlier, binding does not equal activation. Such data have a relatively high false-positive risk, and in the bulk-sequencing era they often captured only the TCR $\beta$ chain, because $\alpha$ and $\beta$ pairing information is lost when cells are lysed.
-
Single-cell sequencing and antigen barcoding (scTCR-seq + feature barcoding): with the spread of single-cell technologies such as 10x Genomics, many recent VDJdb entries come from this approach. The experiment still relies on pMHC multimers, usually dextramers, but this time they carry not only fluorescent labels but also specific DNA barcodes. Different pMHC molecules correspond to different DNA sequences. After cells are incubated with many different pMHC molecules, they are loaded into single-cell droplets. In the same droplet, the cell’s TCR $\alpha$ chain, TCR $\beta$ chain, and the pMHC DNA barcode it bound are measured simultaneously. Data property: this is currently one of the most efficient ways to obtain paired $\alpha\beta$ data. However, because the system is very sensitive, non-specific adhesion can also generate weak DNA signals. Therefore, the data often contain background noise and require strict bioinformatic filtering.
-
Functional activation assays: this is a smaller fraction in VDJdb, but it is high-quality and closest to true activation. The experiment no longer depends on artificial pMHC multimers. Instead, real T cells are co-cultured with antigen-presenting cells (APCs) in a dish, and the target peptide is added. If the TCR recognizes pMHC and completes the full downstream signaling process, including kinetic proofreading and microcluster formation, the T cell is truly activated. Researchers detect surface activation markers such as CD69 and CD137/4-1BB, or measure cytokine secretion through intracellular cytokine staining (ICS) or ELISPOT, and then sort the truly activated T cells for sequencing. Data property: this represents real cellular activation, after a stricter physiological validation chain. It has a low false-positive rate, but the throughput is low, the cost is high, and it is difficult to scale.
2. McPAS-TCR
McPAS-TCR is not strictly an affinity database. It is a pathology-associated TCR catalog, manually curated from the literature (Tickotsky et al., 2017). It organizes TCR sequences associated with infection, autoimmunity, cancer, allergy, and other pathological states. Therefore, its label semantics are more heterogeneous than VDJdb.
The phenomena measured behind it can be roughly divided into two layers:
-
Antigen- or epitope-associated TCRs: if a record provides peptide, MHC restriction, antigen source, and related information, such data usually come from pMHC multimer sorting or functional activation assays described above. I will not repeat the experimental workflow here. The key label meaning is that “a certain TCR is associated with a certain epitope in a specific experimental system.” It may be binding-positive or activation-positive, depending on the assay type in the original record.
-
Pathology-associated TCRs: many records do not directly prove that a TCR recognizes a specific pMHC. Instead, certain TCR clonotypes are observed to be enriched in disease samples, tumor-infiltrating lymphocytes, infected tissues, or expanded clones in peripheral blood. What is measured here is clonal expansion / disease association: this TCR appears or expands in a pathological environment. It does not necessarily recognize the target antigen, and it certainly does not necessarily activate the T cell.
Therefore, McPAS-TCR is better viewed as a clue database for disease-associated TCRs. If it is used to train TCR-pMHC pair models, one must filter for subsets with explicit epitopes, HLA/MHC information, and experimental assay types. Otherwise, bystander T cells, inflammation-driven expansion, and true cognate TCRs can easily be mixed together.
3. PIRD
The core of PIRD is population-scale immune repertoire data. It mainly measures the composition and abundance of TCR/BCR clonotypes in immune repertoires, not TCR-pMHC affinity and not T cell activation (Zhang et al., 2020).
More specifically, the raw data in PIRD usually come from bulk TCR-seq/BCR-seq or single-cell immune repertoire sequencing. The main experimental readouts are:
- CDR3 nucleotide / amino acid sequence
- V, D, and J gene assignment
- clone count and clone frequency
- repertoire diversity
- sample source, disease status, tissue type, and population information
- in single-cell data, possibly paired TCR $\alpha/\beta$ chains or BCR heavy/light chains
Therefore, the PIRD label is closer to repertoire abundance / immune repertoire composition. It answers the question “which TCRs/BCRs are present in an individual, tissue, or disease state, and how abundant are they?” rather than “does this TCR recognize a specific pMHC?”
If some PIRD sub-databases or association tables provide antigen, disease, or epitope information, the original literature still needs to be checked: did the record come from multimer sorting, functional stimulation, disease enrichment, or simple repertoire association? Only the first two are relatively close to TCR-pMHC specificity or T cell activation labels.
4. IEDB
IEDB is one of the easiest data sources to misuse, because it is not a single-task database. Instead, it collects many types of epitope-related experimental results, including T cell, B cell, MHC binding, and ligand-elution data (Vita et al., 2019; Vita et al., 2025). When using IEDB, the key is not whether an entry is called positive, but its assay type.
Common measurement phenomena in IEDB include:
-
MHC-peptide binding: measures the binding ability between peptide and MHC/HLA, such as IC50, KD, or stability score. The affinity here is usually peptide-MHC affinity, not TCR-pMHC affinity. It can indicate whether a peptide can be loaded and presented by HLA, but it cannot directly say whether a TCR will recognize it.
-
MHC ligand elution / mass spectrometry: peptides naturally presented on cell-surface HLA/MHC complexes are eluted and identified by LC-MS/MS. What is measured here is natural presentation: this peptide truly appears on MHC. It does not measure TCR binding or T cell activation.
-
T cell assay: T cells, PBMCs, T cell clones, or T cell lines are stimulated with peptides, and readouts such as IFN-$\gamma$, IL-2, TNF, ELISpot, intracellular cytokine staining, proliferation, cytotoxicity, CD69, CD137/4-1BB, and CD154 are measured. What is measured here is T cell activation / functional response, which is the label closest to the goal of this note.
-
MHC multimer / tetramer staining: measures whether TCRs on the T cell surface can be captured by pMHC multimers. This is closer to pMHC binding / antigen-specific enrichment. It is not single-molecule affinity and does not guarantee downstream activation.
-
B cell / antibody assay: measures recognition of epitopes by antibodies or BCRs. This is not the same problem as TCR-pMHC modeling.
Therefore, IEDB must be split by assay type. For antigen presentation, ligand-elution and MHC-binding data can be used. For TCR-pMHC recognition, multimer or T cell assay data are relevant. For T cell activation prediction, T cell functional assays should be prioritized.
5. ImmRep23
ImmRep23 is a receptor-antigen prediction benchmark, associated with the 2023 immune receptor prediction challenge (Nielsen et al., 2024). Its positive samples mainly come from pMHC multimer/dextramer-positive T cells with single-cell TCR data. The experimental principle is the same as the first two VDJdb sources, so I will not repeat it. The important point is that the main phenomenon measured is pMHC binding / antigen-specific enrichment, not KD and not cellular activation.
Across its sources, the common workflow is: fluorescently labeled or barcoded pMHC multimers/dextramers capture candidate antigen-specific T cells, and then Smart-seq2, 10x Genomics, BD Rhapsody, or ImmunoScape workflows read out paired TCR $\alpha/\beta$ chains. Its advantage is that paired-chain information is relatively complete, making it suitable for training TCR-pMHC recognition models.
However, its negatives require special caution. Many negatives are generated by TCR-peptide swapping: a TCR is paired with another peptide and treated as a presumed negative. These negatives are not individually measured wet-lab non-binders or non-activators, so they are better used as benchmark controls rather than strict biological negative labels.
6. BATCAVE
BATCAVE is the benchmark here that is closest to T cell activation / cross-reactivity. It was introduced with BATMAN and collects TCR cross-reactivity data based on single-amino-acid mutational scans (Banerjee et al., 2025). Rather than simply collecting whether “a TCR has seen an antigen,” it starts from a known index peptide and performs single-amino-acid mutation scanning: one peptide position is changed to other amino acids, and the strength of the same TCR’s response to these mutant peptides is measured.
Its core measured phenomena are functional outputs, such as:
- IFN-$\gamma$ secretion
- NFAT-GFP reporter signal
- other T cell activation reporter or cytokine readouts
Therefore, BATCAVE labels are usually closer to continuous activation strength than to simple binding yes/no. It is especially suitable for studying how sensitive a TCR is to peptide mutations, namely cross-reactivity and mutational escape.
One should note that BATCAVE may also integrate a small amount of TCR-pMHC affinity data, but this is not its main label source. Its main axis remains T cell activation responses induced by mutant peptides.
7. TCR3d / STCRDab / histo.fyi
These three resources are structural resources and should not be mixed with functional labels such as VDJdb, IEDB T cell assays, or BATCAVE.
TCR3d and STCRDab collect experimentally solved TCR, pMHC, TCR-pMHC, or TCR-CD3 structures from the Protein Data Bank. The underlying experiments are mainly X-ray crystallography, with some recent cryo-EM structures. TCR3d is described in Gowthaman and Pierce, 2019 and updated in Lin et al., 2025; STCRDab is described in Leem et al., 2018. These resources measure:
- three-dimensional atomic coordinates
- TCR-pMHC docking angle
- CDR loop conformation
- interface buried surface area
- contact residues between TCR and peptide/MHC
- apo/holo conformational differences
These data answer the question “what does this complex look like, how does it contact, and how does its conformation change?” They do not answer “is this T cell activated?” A small number of entries contain affinity metadata, such as KD, kon, and koff measured by SPR, ITC, or BLI. But that is an additionally integrated physicochemical measurement, not the main label of the structural database.
histo.fyi is more focused on peptide-MHC structural resources. It organizes MHC Class I structures and their bound peptides, including apo pMHC and receptor-bound pMHC. It measures how the peptide sits in the MHC groove, which positions are exposed to TCR, and how groove structures differ across HLA alleles. It does not directly measure TCR specificity or T cell activation.
8. Observed TCR Space (OTS)
OTS is a paired-chain repertoire background resource. It collects truly observed TCR $\alpha/\beta$ pairings from public single-cell TCR repertoires (Raybould et al., 2024). What is measured here is that a certain TCR pair appeared in real human populations or samples, not which pMHC it recognizes.
The core readouts of OTS include:
- paired TRA/TRB CDR3
- V/J gene usage
- clonotype occurrence
- study, sample, donor, and related metadata
Therefore, OTS is suitable for modeling background TCR distributions, negative sampling, language-model pretraining, or repertoire coherence analysis. It should not be directly used as antigen-specific positive data.
9. Adaptive Biotechnologies immuneACCESS
immuneACCESS is Adaptive Biotechnologies’ public immune repertoire data portal. Its main content is immunoSEQ output, which measures the abundance and frequency of TCR/BCR clonotypes, especially unpaired TCR $\beta$ chains. For the underlying immunoSEQ/MIRA antigen-mapping concept, see Klinger et al., 2015.
Common readouts include:
- TCR $\beta$ CDR3 sequence
- V/D/J gene call
- clone count
- clone frequency
- sample, disease, time point, tissue source, and related metadata
Therefore, most immuneACCESS data are similar to PIRD and represent repertoire abundance, not TCR-pMHC binding or activation.
However, one important subset in immuneACCESS is MIRA or similar antigen-mapping data. This approach uses peptide-pool stimulation, enrichment, or sorting of antigen-associated T cells, then performs immunoSEQ on TCR $\beta$ clonotypes before and after enrichment to infer associations between some TCR $\beta$ chains and antigens. What is measured here is antigen enrichment / antigen association. It is usually still not paired $\alpha\beta$ data and not direct KD or complete T cell activation strength.
After reading the above, it should be clear that these datasets actually correspond to different biological processes. They must not be blindly mixed when training models. How to use these datasets appropriately remains an urgent unresolved problem.
Of course, T cell activation never depends only on whether TCR and pMHC match as the first signal. In real physiological and pathological environments, it is more like a multidimensional dynamic game. T cells must also receive co-stimulatory signals such as CD28-mediated signaling (the second signal) to avoid anergy, while tumor cells often express PD-L1 and other immune checkpoints to “hit the brake.” In addition, local cytokine signals (the third signal), the harsh tumor microenvironment (TME), such as hypoxia, high acidity, metabolic competition, and physical stromal barriers, as well as the epigenetic exhaustion state of the T cell itself and the true antigen abundance on the target-cell surface, all directly determine whether activation succeeds. Therefore, a perfect TCR-pMHC match only grants the entry ticket for attack. Pulling the trigger still requires crossing many barriers imposed by the microenvironment and cell state. Hopefully, in the not-too-distant future, we can model a more complete process with more clever methods, perhaps even virtual cells.
Some of the knowledge and information have been compiled by AI. The article represents the author’s personal viewpoint only. The pictures are from the internet. If there are any errors, infringements or other issues, please contact me via jiawei_zhang1@163.com.
V. References
- Rock KL, Reits E, Neefjes J. Present Yourself! By MHC Class I and MHC Class II Molecules.
- Rossjohn J, Gras S, Miles JJ, Turner SJ, Godfrey DI, McCluskey J. T Cell Antigen Receptor Recognition of Antigen-Presenting Molecules.
- Dong D, Zheng L, Lin J, et al. Structural basis of assembly of the human T cell receptor-CD3 complex.
- Courtney AH, Lo WL, Weiss A. TCR signaling: mechanisms of initiation and propagation.
- Chakraborty AK, Weiss A. Insights into the initiation of TCR signaling.
- Hopfield JJ. Kinetic proofreading: a new mechanism for reducing errors in biosynthetic processes requiring high specificity.
- McKeithan TW. Kinetic proofreading in T-cell receptor signal transduction.
- Valitutti S, Muller S, Cella M, Padovan E, Lanzavecchia A. Serial triggering of many T-cell receptors by a few peptide-MHC complexes.
- Davis SJ, van der Merwe PA. The kinetic-segregation model: TCR triggering and beyond.
- Liu B, Chen W, Evavold BD, Zhu C. Accumulation of dynamic catch bonds between TCR and agonist peptide-MHC triggers T cell signaling.
- Zhao X, Kolawole EM, Chan W, et al. Tuning T cell receptor sensitivity through catch bond engineering.
- Campi G, Varma R, Dustin ML. Actin and agonist MHC-peptide complex-dependent T cell receptor microclusters as scaffolds for signaling.
- Monks CRF, Freiberg BA, Kupfer H, Sciaky N, Kupfer A. Three-dimensional segregation of supramolecular activation clusters in T cells.
- Shugay M, Bagaev DV, Turchaninova MA, et al. VDJdb: a curated database of T-cell receptor sequences with known antigen specificity.
- Bagaev DV, Vroomans RMA, Samir J, et al. VDJdb in 2019: database extension, new analysis infrastructure and a T-cell receptor motif compendium.
- Tickotsky N, Sagiv T, Prilusky J, Shifrut E, Friedman N. McPAS-TCR: a manually curated catalogue of pathology-associated T cell receptor sequences.
- Zhang W, Wang L, Liu K, et al. PIRD: Pan immune repertoire database.
- Vita R, Mahajan S, Overton JA, et al. The Immune Epitope Database (IEDB): 2018 update.
- Vita R, Blazeska N, Marrama D, et al. The Immune Epitope Database (IEDB): 2024 update.
- Nielsen M, Eugster A, Jensen MF, et al. Lessons learned from the IMMREP23 TCR-epitope prediction challenge.
- Banerjee A, Pattinson DJ, Wincek CL, et al. T cell receptor cross-reactivity prediction improved by a comprehensive mutational scan database.
- Gowthaman R, Pierce BG. TCR3d: The T cell receptor structural repertoire database.
- Lin V, Cheung M, Gowthaman R, Eisenberg M, Baker BM, Pierce BG. TCR3d 2.0: expanding the T cell receptor structure database with new structures, tools and interactions.
- Leem J, de Oliveira SHP, Krawczyk K, Deane CM. STCRDab: the structural T-cell receptor database.
- Raybould MIJ, Greenshields-Watson A, Agarwal P, et al. The observed T cell receptor space database enables paired-chain repertoire mining, coherence analysis and language modelling.
- Klinger M, Pepin F, Wilkins J, et al. Multiplex Identification of Antigen-Specific T Cell Receptors Using a Combination of Immune Assays and Immune Receptor Sequencing.
- Lu T, Zhang Z, Zhu J, et al. Deep learning-based prediction of the T cell receptor-antigen binding specificity.
- Springer I, Besser H, Tickotsky-Moskovitz N, Dvorkin S, Louzoun Y. Prediction of Specific TCR-Peptide Binding From Large Dictionaries of TCR-Peptide Pairs.
- Peng X, Lei Y, Feng P, et al. Characterizing the interaction conformation between T-cell receptors and epitopes with deep learning.